The Seller Financing Stats are In for 2021
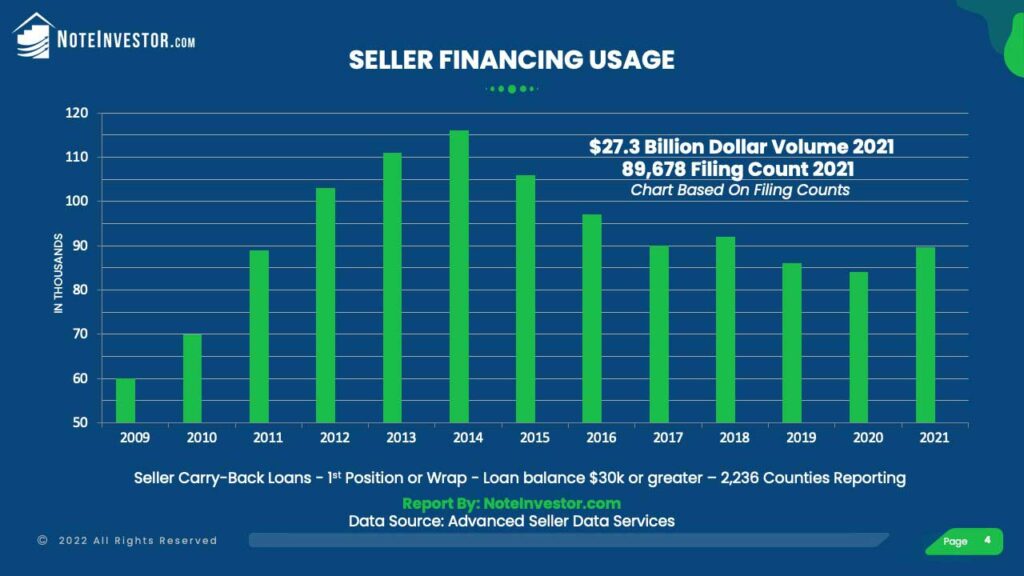
- There was nearly a 7% increase in the number of notes created through seller financing with 89,678 in 2021 compared to 84,007 in 2020.
- The dollar volume of new owner financed notes was $27.32 Billion, a 15.92% increase from the $23.57 Billion created in 2020.
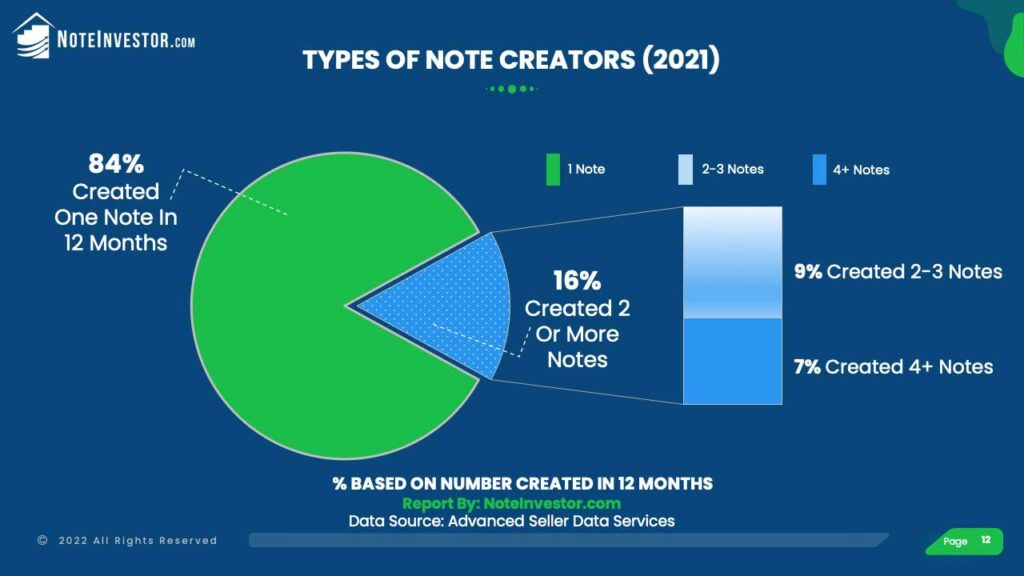
- Sellers originating more than 2 notes within 12 months made up 16% of the notes created.
- Ten states were responsible for 68.5% of the new seller-carry notes created in 2021.
- The average Loan-to-Value (LTV) was:
- 77% LTV on new Residential notes
- 71% LTV for Commercial, and
- 70% LTV for Land notes.
- $123 Billion in owner financed notes were created in the past 5 Years (2017 to 2021)
What Can We Learn from the Seller Financing Trends in 2021?
Hear are some takeaways from Scott Arpan of Advanced Seller Data Services:
“Seller-carry note creation jumped nearly 7% in 2021 over 2020. Over 84% of notes created in 2021 were made by one-off sellers, a 10% increase over 2020.
Large residential loans made the biggest gain in 2021. Residential loan volume grew at an astonishing rate to over $14 billion. Breaking through the $10 billion ceiling for the first time in at least ten years. Commercial loan volume also made great gains over 2020, jumping nearly 60% to over $7 billion.
The average size of a residential loan jumped nearly 50% to $269,000. Residential notes also saw an average down payment increase of 5%. This is the first year since tracking started the average down payment on a residential note was greater than 20%. Commercial and land notes also saw roughly 5% larger down payments in 2021.
This data suggests the mom-and-pop seller-carry market has recovered from its pandemic woes of 2019 & 2020.
I was surprised by the large jump in residential loan volume. To double check my findings we looked closer at the residential note market on loans over $250,000. We found 78% of these note holders were individuals or revocable trusts and the average loan size of their loans was $875,000.
This indicates higher end mom-and-pop sellers who did not want to carry a note during the pandemic are much more open to earning interest secured by real estate they know and have vetted their buyers carefully. Their primary alternatives are a low interest savings account or a volatile stock market.
The overall mom-and-pop note market is set to make great gains with the following likely events: 1) interest rates rise as anticipated; 2) lenders increase borrower standards due to uncertainty in the financial markets; and 3) Demand for real estate falls creating a buyer’s market.
Historically, the mom-and-pop note market grows when any of these events take place. They usually occur together to some degree. As the number of qualified buyers decline, more sellers who did not want to seller finance are forced to create a note to move on from the property. This also creates a much larger pool of motivated note sellers since they did not want to manage a note in the first place.
While the next 12 months will be very difficult to predict, I believe we are setting up to see a much greater number of seller-carried notes and motivated note holders.”
Over the Years – the Seller Financing Numbers
| Year | 2012 | 2013 | 2014 | 2015 | 2016 | 2017 | 2018 | 2019 | 2020 | 2021 |
| Count | 103,313 | 110,979 | 116,178 | 105,871 | 97,089 | 89,779 | 91,605 | 86,155 | 84,007 | 89,678 |
| Change | +15.5% | +7.4% | +4.7% | -8.9% | -8.3% | -7.5% | +2% | -5.95% | -2.49% | +6.75% |
Where Are The Notes At? – Top States for Owner Financing
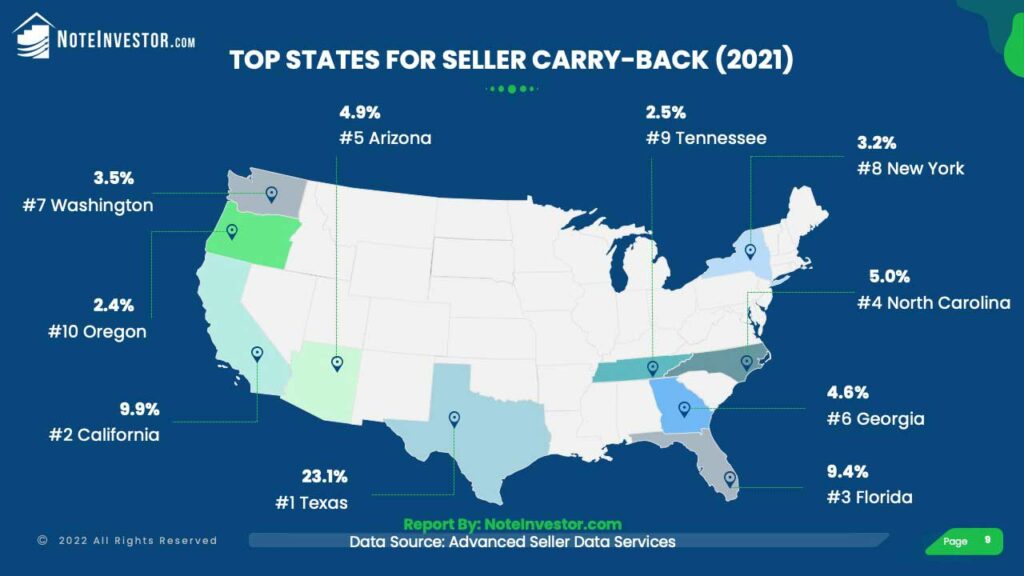
The Top 5 states for seller carry backs continued to be Texas, California, Florida, North Carolina, and Arizona. All combined, the top 10 states for the creation of seller financed notes made up 68.5% of the overall volume.
| State | 2021 Count | Percentage |
| Texas | 20,752 | 23.1% |
| California | 8,857 | 9.9% |
| Florida | 8,447 | 9.4% |
| North Carolina | 4,479 | 5.0% |
| Arizona | 4,406 | 4.9% |
| Georgia | 4,147 | 4.6% |
| Washington | 3,174 | 3.5% |
| New York | 2,856 | 3.2% |
| Tennessee | 2,260 | 2.5% |
| Oregon | 2,162 | 2.4% |
| Top 10 | 61,540 | 68.5% |
| All 50 States | 89,678 |
Wondering how the remaining 40 states compared? Download the full report for a state by state listing.
It’s Not Just Residential Notes – Carry Back Notes by Property Type
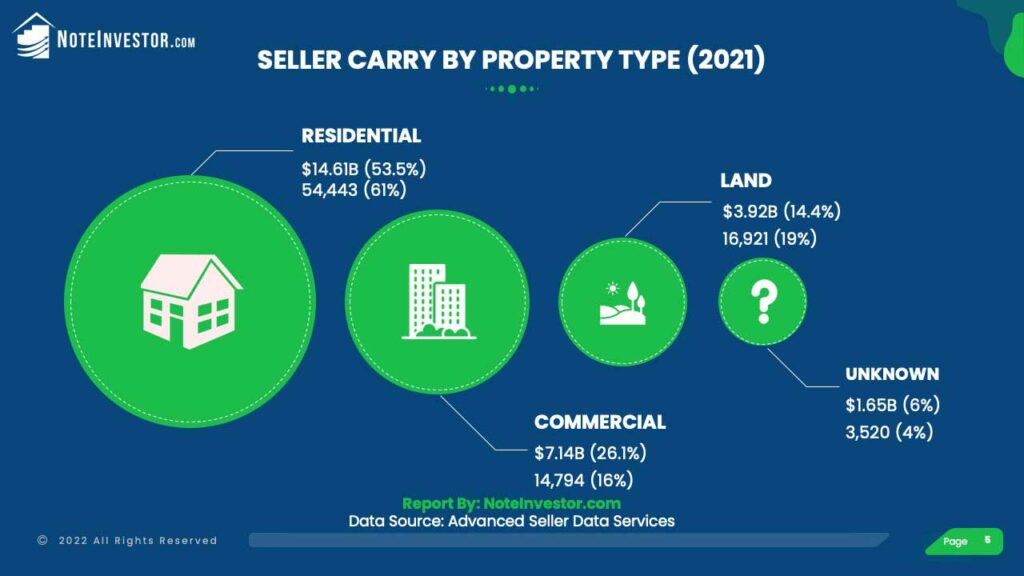
Seller-carry covers residential, commercial, and land. Here is a look at the number of notes created by property type (from records where property type is known).
| 2017 | % | 2018 | % | 2019 | % | 2020 | % | 2021 | % | |
| Residential | 42,916 | 48% | 49,169 | 54% | 46,891 | 54.5% | 42,359 | 50% | 54,443 | 61% |
| Commercial | 13,930 | 16% | 13,484 | 15% | 10,458 | 12% | 10,588 | 13% | 14,794 | 16% |
| Land | 13,417 | 15% | 12,176 | 13% | 12,956 | 15% | 13,608 | 16% | 16,921 | 19% |
| Unknown | 19,516 | 22% | 16,777 | 18% | 15,850 | 18.5% | 17,452 | 21% | 3,520 | 4% |
| 89,779 | 91,605 | 86,155 | 84,007 | 89,678 |
Average Note Size, Down Payment and LTV For Seller Financing
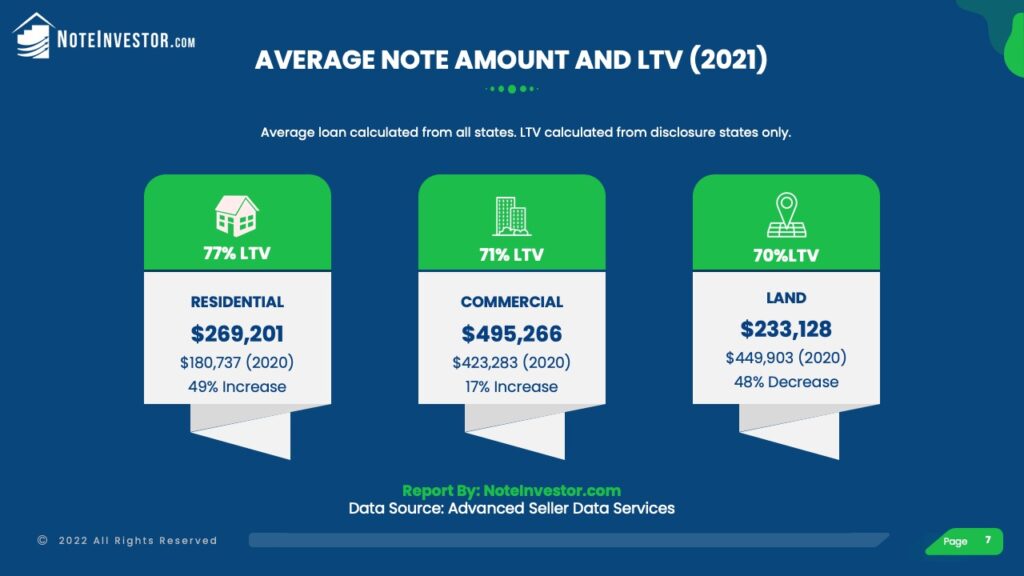
The average residential note balance was $269,201 for seller carried notes in 2021. The average Loan-to-Value (LTV) was 77% which correlates to a down payment of 23%. Many people mistakenly believe that all seller financing involves little to no money down. However this chart shows the average down payment has been 20% or more in all property categories for the past 4 years (LTV calculated using data from states with sales price disclosure).
| 2018 | LTV% | 2019 | LTV% | 2020 | LTV% | 2021 | LTV% | |
| Residential | $195,062 | 81% | $196,926 | 80% | $180,737 | 82% | $269,201 | 77% |
| Commercial | $407,363 | 75% | $414,676 | 74% | $423,283 | 75% | $495,266 | 71% |
| Land | $605,312 | 74% | $468,583 | 75%% | $449,903 | 76% | $233,128 | 70% |
Single Note vs. Multi-Note Creations
The group of sellers creating 2 or more notes in a 12 month period were responsible for 16% of the new notes created. When you break down this group further we see 9% in the 2-3 notes per year and 7% in the 4 or more category. This group is often considered a professional user of seller financing in comparison to the “Mom and Pop” seller that just creates a single note in a year. There are also differences in the exemptions and requirements under the Dodd Frank Act based on the number of seller carry-back notes.
| 2016 | 2017 | 2018 | 2019 | 2020 | 2021 | |
| Note Count Where Seller Created 1 Note* | 78,616 | 76,675 | 75,116 | 74,586 | 68,257 | 75,279 |
| (% of Notes Created by Count) | 81% | 85% | 82% | 87% | 81% | 84% |
| Note Count from Sellers Creating More Than 1 Note* | 18,473 | 13,104 | 16,489 | 11,569 | 15,750 | 14,399 |
| Totals | 97,089 | 89,779 | 91,605 | 86,155 | 84,007 | 89,678 |
Thanks to Advanced Seller Data Services, a mailing list provider for providing these 2021 stats. They are based on 2,236 counties reporting, balances of $30,000 or higher, on 1st position or wrap/AITD notes.
What are your thoughts on the recent statistics? Do you think the decrease in the mortgage affordability index will lead to another increase in owner financing in 2022? Will the red-hot real estate market continue or will it cool with rising interest rates? Leave your comments below.


Does the ‘commercial’ category include seller financing of small businesses (acquisition funding)
Hello JB, It includes seller financing on real estate that was classified as commercial. That could include some small business sales if those sales included real estate with it. If a business was sold or acquired with seller financing without any real estate involved then it wouldn’t be included in these numbers. Seller financing is used quite a bit on business only sales. You can find more information on that here: https://noteinvestor.com/note-brokers/brokering-business-notes-interview/
Hi – I was curious to see if you had any data regarding the delinquency rates for seller financing compared to conventional mortgages?
Hello Buck, Great question. There is no central reporting by individual seller financed note holders on delinquency. We can look to historical data from buyers of those notes. That delinquency can vary depending on the buying guidelines of the individual note buyer. There are some seller financed notes with strong down payments and solid credit/capacity that have lower delinquency rates while notes with low down payments and poor credit could have higher default rates than conventional mortgages. In general, as a broad statement, I would estimate seller financed delinquency rates to be about 2-4% higher than conventional but that can be equalized or minimized with strong underwriting upfront at creation or later on the secondary marketing buying side.