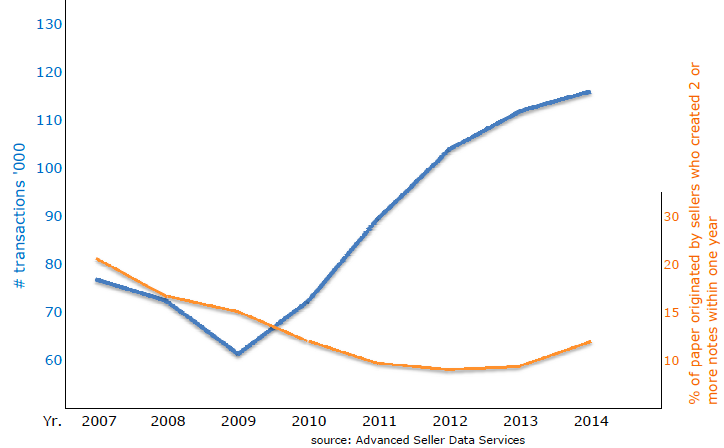
“The number of seller financed notes created in 2014 increased by 4.7%,” reports Scott Arpan of NoteSellerList.com.
There is one number we all want to know…
…how many seller financed notes are being created?
Each year, around this time, Advanced Seller Data Services releases some very important numbers.
This running tally not only shows the number of notes created it also breaks them down by state!
More notes equals more opportunities to buy notes.
Knowing the “hottest” states allows you to tweak and target your marketing pieces or website to attract note sellers.
We could talk to you for days about the benefits of this information, but we think it is better to SHOW YOU.
Matter of fact, we even shot a video to go along with the results!
Owner Financing Growth From 2010 to 2014
This increase has continued for the past 5 years since the market low in 2009.
| Year | 2009 | 2010 | 2011 | 2012 | 2013 | 2014 |
| Count | 60,035 | 70,159 | 89,439 | 103,313 | 110,979 | 116,178 |
| % Change | 16.9% | 27.5% | 15.5% | 7.4% | 4.7% |
Impact of Dodd Frank Regulation on Seller Financing
The Dodd-Frank Act was implemented in January of 2014 imposing new laws for mortgage origination. While the regulation provided exemptions for certain seller carry notes (differentiating between the creation of 1, 3, and more than 3 notes) it also created uncertainty on the impact to note creation. It was encouraging to see that seller financing increased overall in 2014. The surprising part was the large increase in sellers creating more than one note.
| 2013 | 2014 | Change | |
| Seller Created 1 Note* | 101,546 | 102,227 | 0.7% |
| Notes From Sellers Creating More Than 1 Note* | 9,433 | 13,951 | 47.9% |
| *2nd Note was created within 1 year of first note |
Scott Arpan shared his observations, “The subgroup of sellers creating 2 or more notes within a year jumped nearly 50%. Nearly all of the sellers originating multiple notes sold residential properties. They appear to be landlords divesting properties, rehabbers and developers.”
Top 10 States For Seller Financing In 2014
The top three states for note creation were once again Texas, California and Florida with the top 10 producing states comprising 62% of the volume.
| State | Count | Percentage |
| Texas | 23,674 | 20.4% |
| California | 11,412 | 9.8% |
| Florida | 10,137 | 8.7% |
| North Carolina | 4,730 | 4.1% |
| Arizona | 4,472 | 3.8% |
| Georgia | 4,197 | 3.6% |
| Washington | 4,184 | 3.6% |
| Ohio | 3,854 | 3.3% |
| Oregon | 2,727 | 2.3% |
| Iowa | 2,674 | 2.3% |
| Top 10 | 72,061 | 62% |
| All 50 States | 116,178 |
These 2014 statistics were based on 2,124 counties reporting across the U.S. and provided by Advanced Seller Data Services, a list provider for note brokers and investors. It includes first position or wrap seller carry notes with balances of $30,000 or greater. The report provides insights to real property type, market outlook, and state by state note counts.
For full details Click Here To Download the Seller Carry Note Report in PDF.


Leave a Reply