
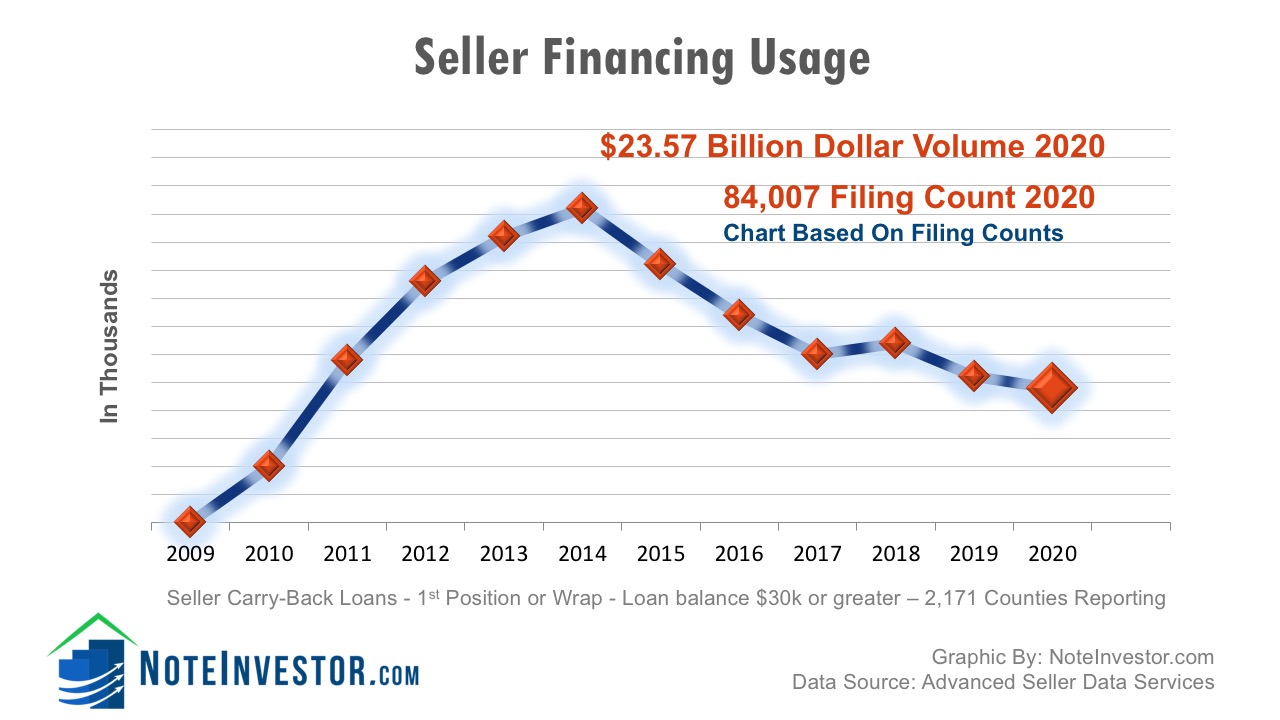
The number of notes created through owner financing in 2020 reached $23.57 Billion.
2020 Real Estate Note Industry by the Numbers
- The dollar volume of new seller financed notes was $23.57 Billion which was a small 1.78% decrease from the $23.9 Billion created in 2019.
- There were 84,007 seller financed 1st position notes in 2020 compared to 86,155 in 2019.
- The Non-Residential sector grew 5.7% by count and 7.2% by volume compared to 2019.
- Residential notes were the primary contributor to the overall decline with decreases of 10.7% by count and 20% by dollar volume compared to 2019.
- Sellers originating 4 or more notes within 12 months almost doubled from 2019.
- Ten states were responsible for 70% of the new seller-carry notes created in 2020.
- The average Loan-to-Value (LTV) was:
- 82% LTV on new Residential notes
- 75% LTV for Commercial, and
- 76% LTV for Land notes.
- $116.6 Billion in owner financed notes were created in the past 5 years (2016 through 2020).
Was 2020 as Crazy for Seller Financing as it was for the Rest of Us?
The economy and real estate were strong in 2019. Home mortgages through traditional lenders were plentiful with low rates. These factors were behind the reduction of new seller carry-backs in 2019. But what about 2020? Things took an unprecedented turn when approximately 97% of the US went under some sort of stay at home orders from the Coronavirus outbreak.
During 2020 we saw a market at odds with itself. In the midst of a pandemic and high unemployment we had a red hot real estate market fueled by cash buyers and historically low interest rates.
Scott Arpan of Advanced Seller Data Services provides these insights:
“Given all the uncertainties of 2020, the note market fared well. Total note creation only fell a couple thousand notes. Origination of non-residential Seller financed notes grew 5.7% from 2019 (39,264 notes created) to 2020 (41,648 notes). Loan volume of non-residential notes in 2020 jumped 7.2% over 2019 levels. Residential notes declined 10.7% from 2019 levels while residential loan volume fell 20%.
Also significant was note creation by one-off “mom and pop” sellers dropped 9% from 2019. Counts of notes by sellers originating 4 or more notes within 12 months almost doubled from 2019. The drop in residential loan volume combined with a huge increase in multi-note originators indicates the only market sector hurt in 2020 were “mom and pop” sellers.
Many multi-note originators work in the lower price range of the residential market thus creating notes of lower amounts. They also require a sizable down payment, so the LTV average did not significantly change. Secondly, sellers of larger and more desirable properties did not need or want seller financing for the reasons listed below.
There are several reasons mom and pop seller notes declined while the rest of the market grew.Individual sellers were not as willing to have potentially infectious buyers entering their property which is often their home.
- Individual sellers were note as willing to have potentially infectious buyers entering their property which is often their home.
- Fear of creating a note with buyers who might face future financial setbacks due to the pandemic.
- Historically low interest rates allowed marginal buyers to afford conventional loans, bypassing the need for seller financing. Sellers were not forced to carry financing with a larger pool of buyers able to pay cash for properties.
I believe the mom-and-pop residential note market is due for a big comeback for several reasons.
- Many buyers were harmed financially by the pandemic and will not qualify for conventional loans. While bankers are not supposed to consider missed rent or mortgage payments on loan applications, the borrower’s savings and delinquent consumer loan payments will be reviewed. This will create a larger block of buyers who require seller financing.
- Interest rates are rising after falling to historical lows to keep the economy stimulated. Lower rates made loans more affordable for everyone creating a huge demand for homes across the country.
- As rates rise and those buyers wanting to move up leave the market, housing stocks will return to normal leaving more sellers open to seller financing to sell their house timely.
- Rising rates also prevent marginally qualified buyers from affording a conventional mortgage making them tempting buyers for seller financing.
Gains in all other sectors of the note market indicate seller financing remains a viable method for selling real estate. Most note sectors rise and fall within narrow margins of each other. Without the 2020 pandemic, it is likely the mom-and-pop residential market would have seen similar increases as the rest of the market.”
Seller Financed Notes From 2010 to 2020
| Year | 2011 | 2012 | 2013 | 2014 | 2015 | 2016 | 2017 | 2018 | 2019 | 2020 |
| Count | 89,439 | 103,313 | 110,979 | 116,178 | 105,871 | 97,089 | 89,779 | 91,605 | 86,155 | 84,007 |
| Change | +27.5% | +15.5% | +7.4% | +4.7% | -8.9% | -8.3% | -7.5% | +2% | -5.95% | -2.49% |
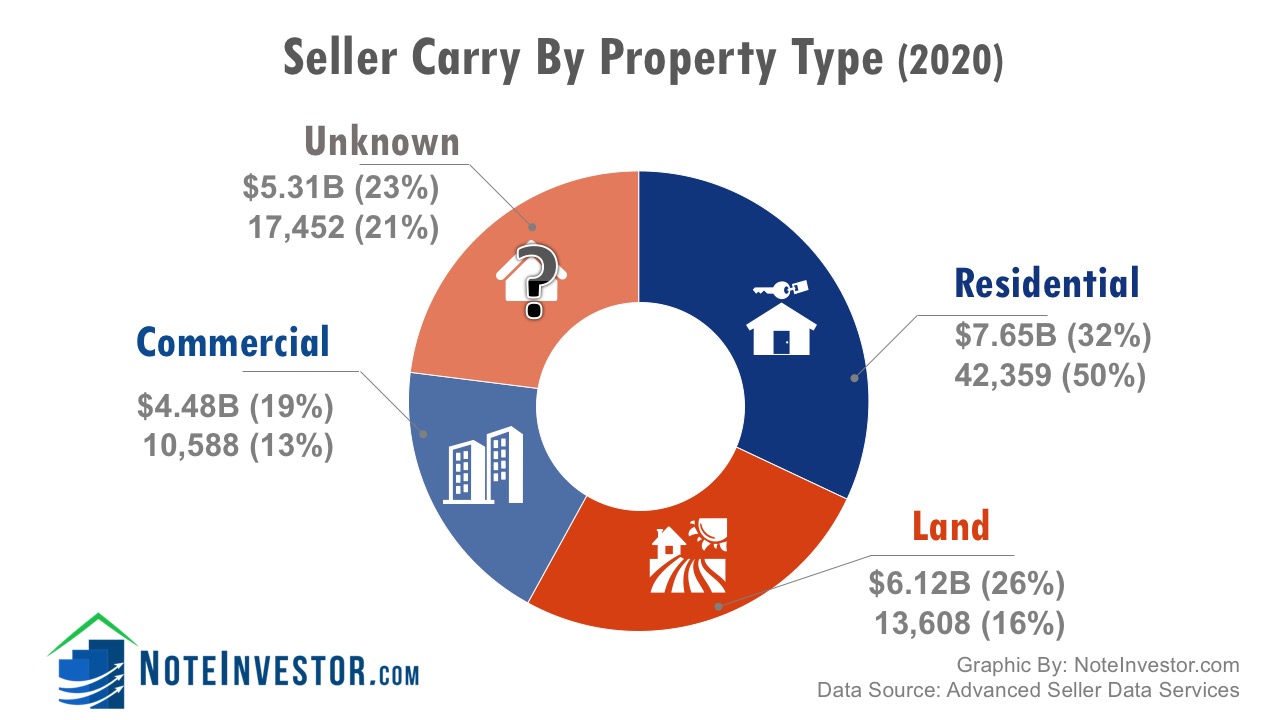
Owner Financing and Property Type
The number of notes created by property type (from records where property type is known).
| 2016 | % | 2017 | % | 2018 | % | 2019 | % | 2020 | % | |
| Residential | 47,651 | 49% | 42,916 | 48% | 49,169 | 54% | 46,891 | 54.5% | 42,359 | 50% |
| Commercial | 14,467 | 15% | 13,930 | 16% | 13,484 | 15% | 10,458 | 12% | 10,588 | 13% |
| Land | 11,784 | 12% | 13,417 | 15% | 12,176 | 13% | 12,956 | 15% | 13,608 | 16% |
| Unknown | 23,187 | 24% | 19,516 | 22% | 16,777 | 18% | 15,850 | 18.5% | 17,452 | 21% |
| 97,089 | 89,779 | 91,605 | 86,155 | 84,007 |
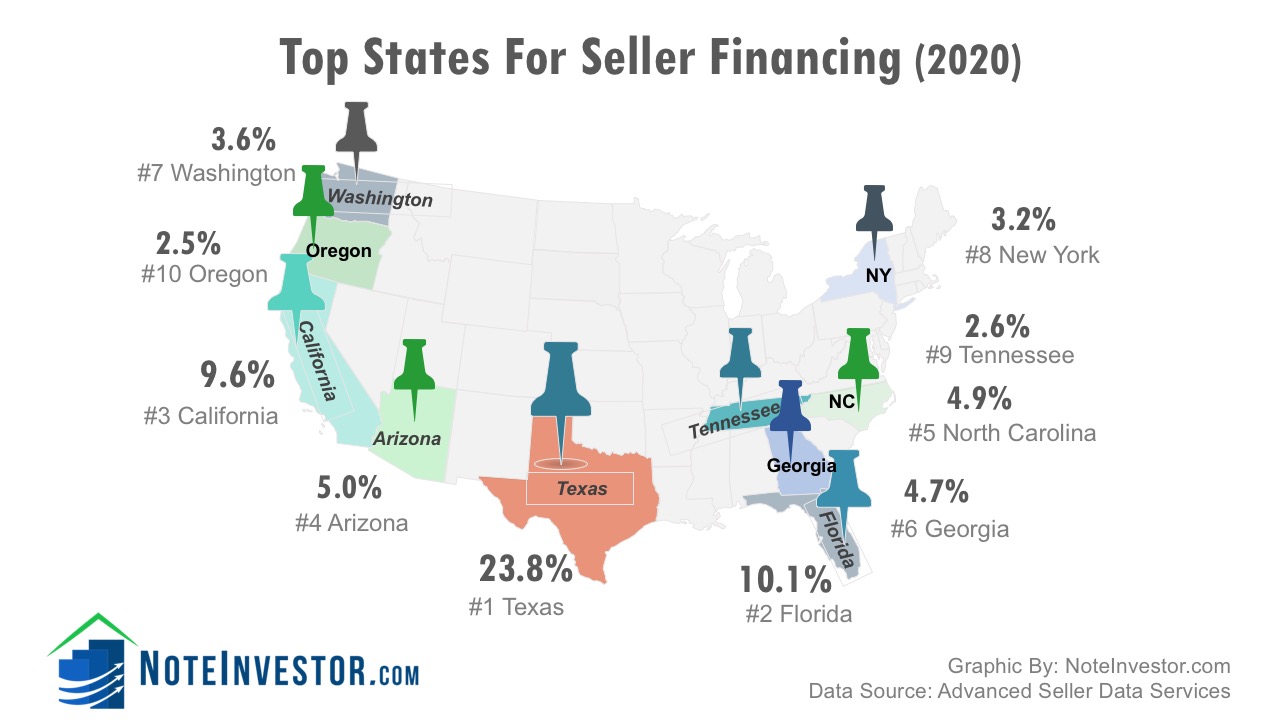
2020 Top States for Seller Financing
The Top 5 states for seller carry backs continued to be Texas, Florida, California, Arizona and North Carolina. All combined, the top 10 states for the creation of seller financed notes made up 70% of the overall volume.
| State | 2020 Count | Percentage |
| Texas | 19,958 | 23.8% |
| Florida | 8,491 | 10.1% |
| California | 8,079 | 9.6% |
| Arizona | 4,196 | 5.0% |
| North Carolina | 4,082 | 4.9% |
| Georgia | 3,919 | 4.7% |
| Washington | 3,026 | 3.6% |
| New York | 2,713 | 3.2% |
| Tennessee | 2,197 | 2.6% |
| Oregon | 2,098 | 2.5% |
| Top 10 | 58,759 | 70% |
| All 50 States | 84,007 |
Wondering how the remaining 40 states compared? Download the full report for a state by state listing.
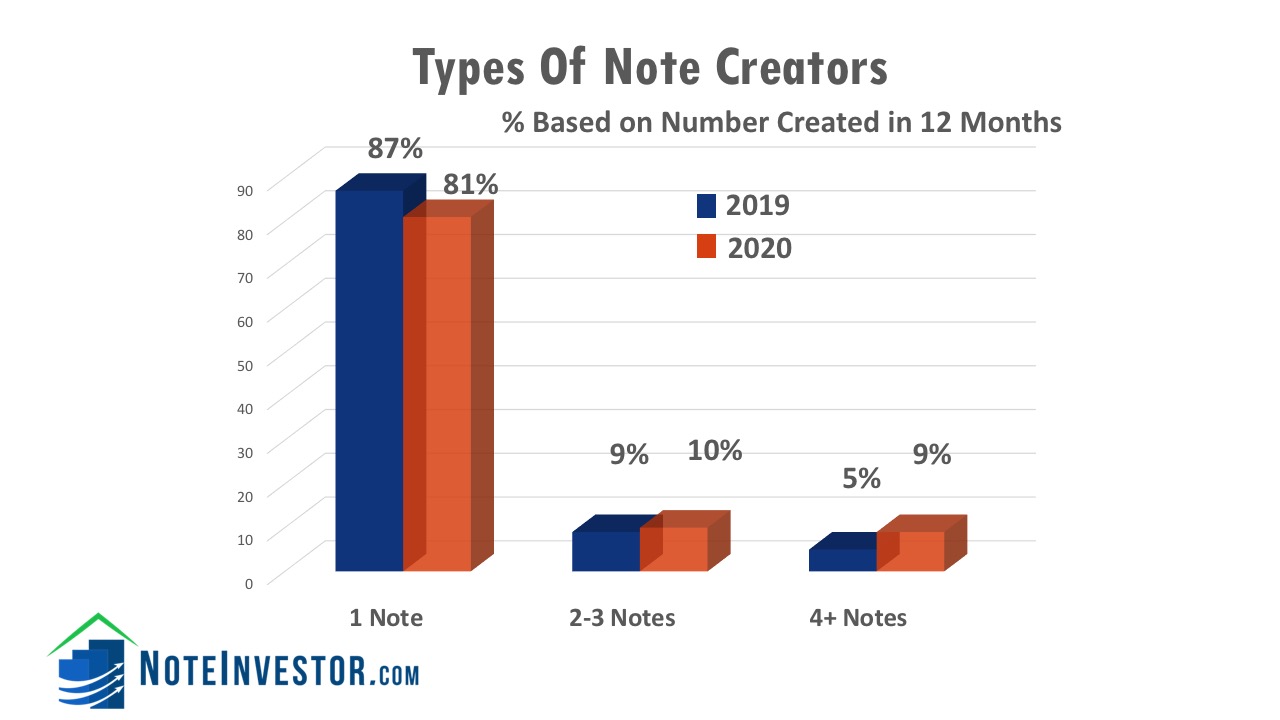
Single Note Creators Vs. Multi Note Creators
The group of sellers creating 2 or more notes in a 12 month period were responsible for 19% of the new notes created. When you break down this group further we see 10% in the 2-3 notes per year and 9% in the 4 or more category. This group is often considered a professional user of seller financing in comparison to the “Mom and Pop” seller that just creates a single note in a year. There are also differences in the exemptions and requirements under the Dodd Frank Act based on the number of seller carry-back notes.
| 2015 | 2016 | 2017 | 2018 | 2019 | 2020 | |
| Note Count Where Seller Created 1 Note* | 90,078 | 78,616 | 76,675 | 75,116 | 74,586 | 68,257 |
| (% of Notes Created by Count) | 85% | 81% | 85% | 82% | 87% | 81% |
| Note Count from Sellers Creating More Than 1 Note* | 15,793 | 18,473 | 13,104 | 16,489 | 11,569 | 15,750 |
| Totals | 105,871 | 97,089 | 89,779 | 91,605 | 86,155 | 84,007 |
Thanks to Advanced Seller Data Services, a mailing list provider for providing these 2020 stats. They are based on 2,171 counties reporting, balances of $30,000 or higher, on 1st position or wrap/AITD notes.
What are your thoughts on the recent statistics? Do you think the decrease in the mortgage affordability index will lead to an increase in seller financing? Will the red-hot real estate market continue or will it cool with rising interest rates? Leave your comments below.

Leave a Reply