
After 5 years of growth owner financed note creation was down 8.9% in 2015 compared to 2014.
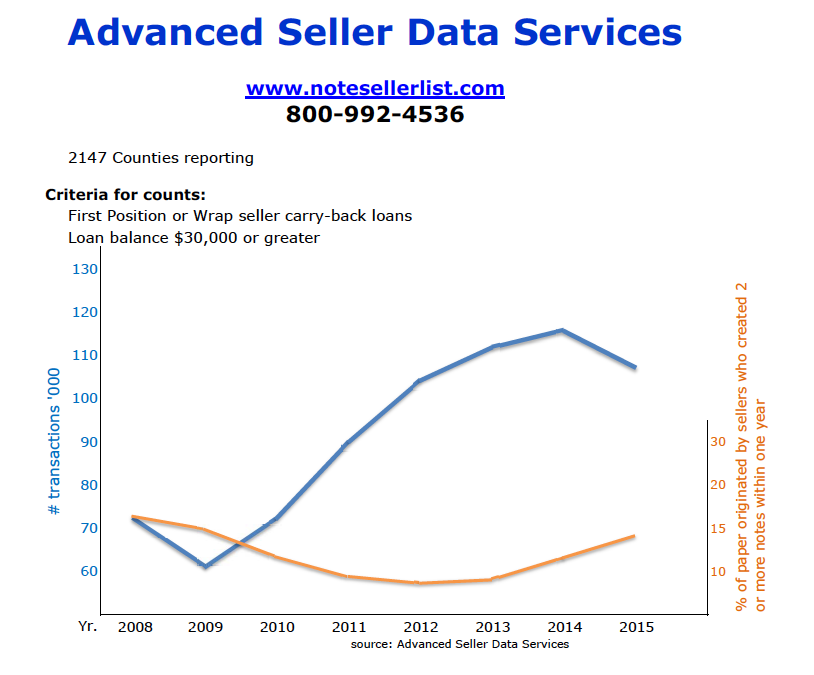
According to annual statistics released by Advanced Seller Data Services there were 105,871 seller financed notes created in 2015 compared to 116,178 in 2014 (based on 2147 counties reporting, $30,000 or greater balance, and 1st position or wrap/AITD notes).
“This is the first year since 2009 the number of seller carry-back notes created dropped from the previous year. New regulations appear to have scared some “mom and pop” note holders out of the market,” comments Scott Arpan of Advanced Seller Data Services.
After the Dodd-Frank Act went into effect in January 2014 we waited to see the impact. That first year the numbers continued to increase but this year that is not the case. Interestingly most “one-off” note sellers fall under an exemption from the regulation (with the law differentiating between the creation of 1, 3, and more than 3 notes). However, the category of sellers carrying back just one note was the most impacted by the decrease (see chart below). So are sellers concerned or are there additional forces at work?
| 2013 | 2014 | 2015 | |
| Seller Created 1 Note* | 101,546 | 102,227 | 90,078 |
| Notes From Sellers Creating More Than 1 Note* | 9,433 | 13,951 | 15,793 |
| Totals | 110,979 | 116,178 | 105,871 |
| *2nd Note was created within 1 year of first note |
2015 Note Production Exceeds Annual Results In 2008 – 2012
After the real estate crash we saw large increases in seller financing (including a whopping 27.5% in 2011). As the markets stabilize it stands to reason note creation will also stabilize. In many regions of the country it has gone from a buyer’s market to a seller’s market which means property owners don’t have to make as many concessions. When we look at overall note creation in 2015 the numbers still exceed production for each of the years from 2009 through 2012. The chart below puts it into perspective:
| Year | 2009 | 2010 | 2011 | 2012 | 2013 | 2014 | 2015 |
| Count | 60,035 | 70,159 | 89,439 | 103,313 | 110,979 | 116,178 | 105,871 |
| Change | +16.9% | +27.5% | +15.5% | +7.4% | +4.7% | -8.9% |
We found last year to be an excellent balance of inventory and investor interest. The notes created during the years with large increases have had a chance to season and property values have increased giving transactions more equity. This reduces the risk resulting in more attractive pricing.
While we would rather see an increase of note creation over a decrease, overall we are not alarmed by this one year change.
So where is the potential opportunity?
First, we need to further understanding of the Dodd – Frank Act. If a transaction does not fall under an exemption there are licensed MLOs (mortgage loan originators) that are knowledgeable in documenting a transaction for compliance. Some resourceful note pros have teamed up with loan officers to create classes on seller financing that qualify for real estate agent continuing education units (CEUs). By surrounding yourself with a good team you can get deals done where others overlook the opportunity.
Second, there are ways to create your own market by purchasing homes and selling with owner financing.
Third, we can dig into the numbers to see where we can best focus our marketing efforts.
2015 Top 10 Producing States For Seller Carry Notes
The Top 10 states for the creation of seller carried notes made up 60.6% of the overall volume with the top three states for note production remaining Texas, California and Florida.
| State | 2015 Count | Percentage |
| Texas | 19,808 | 18.7% |
| California | 10,737 | 10.1% |
| Florida | 9,316 | 8.8% |
| Washington | 4,345 | 4.1% |
| North Carolina | 4,236 | 4.0% |
| Arizona | 3,383 | 3.2% |
| Georgia | 3,645 | 3.4% |
| Ohio | 3,511 | 3.3% |
| Oregon | 2,761 | 2.6% |
| Tennessee | 2,441 | 2.3% |
| Top 10 | 64,183 | 60.6% |
| All 50 States | 105,871 |
These 2015 statistics were provided by Advanced Seller Data Services, a lead provider for note brokers and investors.
For full details on all 50 states you can Click Here To Download the 2015 Seller Carry Note Report in PDF.
What are your thoughts on the recent statistics? We’d love to hear your feedback in the comment section below this article.

Tracy, How does the Dodd- Frank apply to 2nds. I can’t seam to get a strait answer from anyone.
Very helpful, please continue.