Seller financing statistics reveal dollar volume jumped 2% while the number of new seller-carried notes fell by 7.5% in 2017.
 Overall there were 89,779 first position owner financed notes, totaling $17.3 billion. This was an increase of 2% from last year’s total of $16.97 billion.
Down payments have increased continually the past 4 years. On commercial properties they increased 4% in 2016. This indicates strong borrowers buying owner financed properties. What does this mean for the industry?
“The market appears to be moving toward notes with larger balances and great buyer’s equity. This means better quality notes are available compared to past years.” comments Scott Arpan of Advanced Seller Data Services.
7 Key Owner Financing Statistics For 2017
- Almost $8 billion in seller financed notes were created on residential properties.
- The average loan size for residential properties increased 12% over 2016 value from $165,045 to $184,992.
- Arizona, Nevada, Utah and Colorado all created more notes in 2017 than in 2016. California, Oregon and Washington saw the largest decline in note production.
- Florida jumped over California as the second largest note producer. California is now third in seller note production.
- Texas slowed slightly but still produced more notes than Florida and California combined.
- The number of sellers who only carried one note increased by 5% compared to the entire 2017 market.
- The number of notes originated by sellers creating 2 or 3 notes in a year decreased 34% year to year within that category. The number of notes originated by sellers creating 4 or more notes is down 66% year to year within category.
Where Are We In The Seller Financing Cycle?
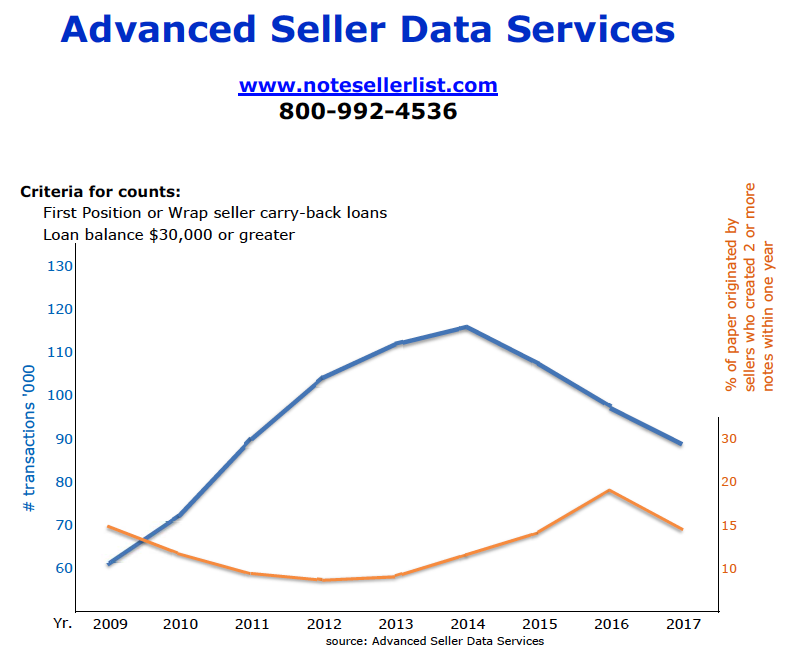
After the subprime meltdown, conventional lending tightened and it was tough for buyers to get financing. This contributed to 5 years of seller financing increases from 2009-2014. As real estate and lending markets stabilized so did the usage of seller financing.
Now many real estate markets are appreciating, interest rates are low, and credit is readily available. Owner financing levels are now similar to 2011-2012 as this graph helps visualize:
Usage of Seller Financing From 2009 to 2017
| Year | 2010 | 2011 | 2012 | 2013 | 2014 | 2015 | 2016 | 2017 |
| Count | 70,159 | 89,439 | 103,313 | 110,979 | 116,178 | 105,871 | 97,089 | 89,779 |
| Change | +27.5% | +15.5% | +7.4% | +4.7% | -8.9% | -8.3% | -7.5% |
Single Note Creators Vs. Multi Note Creators
The number of sellers creating multiple notes declined while the number of “one-off” notes created increased. This is an interesting statistic to track since there are certain exemptions to the Dodd Frank Act for seller financiers that create 1 note and those that create 3 or less (in a 12 month period).
| 2014 | 2015 | 2016 | 2017 | |
| Seller Created 1 Note* | 102,227
88% |
90,078
85% |
78,616
81% |
76,675
85% |
| Notes From Sellers Creating More Than 1 Note* | 13,951 | 15,793 | 18,473 | 13,104 |
| Totals | 116,178 | 105,871 | 97,089 | 89,779 |
| *2nd Note was created within 1 year of first note |
Top 10 States For Seller Financed Notes In 2017
The Top 10 states for the creation of seller financed notes made up 61.73% of the overall volume.
| State | 2017 Count | Percentage |
| Texas | 17,262 | 19.23% |
| Florida | 8,723 | 9.72% |
| California | 8,502 | 9.47% |
| Arizona | 4,136 | 4.61% |
| Washington | 3,870 | 4.31% |
| North Carolina | 3,838 | 4.27% |
| Georgia | 2,639 | 2.94% |
| Tennessee | 2,299 | 2.56% |
| Pennsylvania | 2,079 | 2.32% |
| Oregon | 2,077 | 2.31% |
| Top 10 | 55,425 | 61.73% |
| All 50 States | 89,779 |
These 2017 statistics were provided by Advanced Seller Data Services, a mailing list provider for note investors and brokers. Stats are based on 2135 counties reporting, $30,000 or greater balance, and 1st position or wrap/AITD notes.
Click Here To Download The PDF With Seller Financing Stats On All 50 States.
What are your thoughts on the recent statistics? We’d love to hear your feedback in the comment section below this article.


Great stats. Texas dominating! Thanks for the article
Could the reduction translate to more flexible/less requirements by traditional lending sources in the last three years?
Hi Tracy
Great info…to bring out one point on the drop in notes in 2017.
We have seen the overall availability of homes for owner financing
drop a bit in many areas. But it depends on what price point you
choose to create a note to owner finance too.
Would love to find stats on available homes for sale nationwide
less than $50K which is a sweet spot for owner finance negotiation.
Thanks for bringing this super info.
Katherine
Great point Katherine! I agree with you that the 50-100K is a sweet spot for seller financing and would say those statistics are likely on the increase. I’ll ask our list provider if there is any way to break those out.