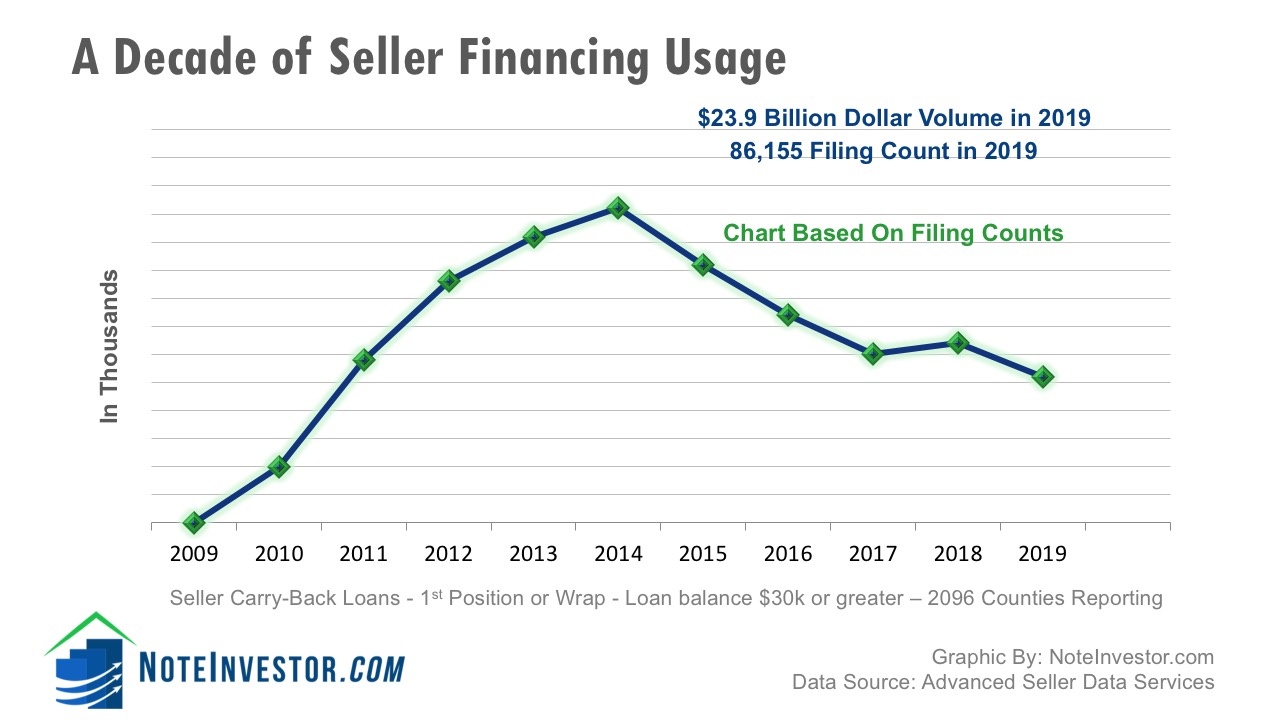
The number of notes created through owner financing in 2019 reached $23.9 Billion.
2019 Owner Financing Numbers At A Glance
- There were 86,155 seller financed 1st position notes in 2019 compared to 91,605 in 2018, a 5.95% decrease.
- The dollar volume of $23.9 Billion was a 7.41% decrease from the $24.9 Billion in 2018.
- Almost 70% of the notes were created in just ten states.
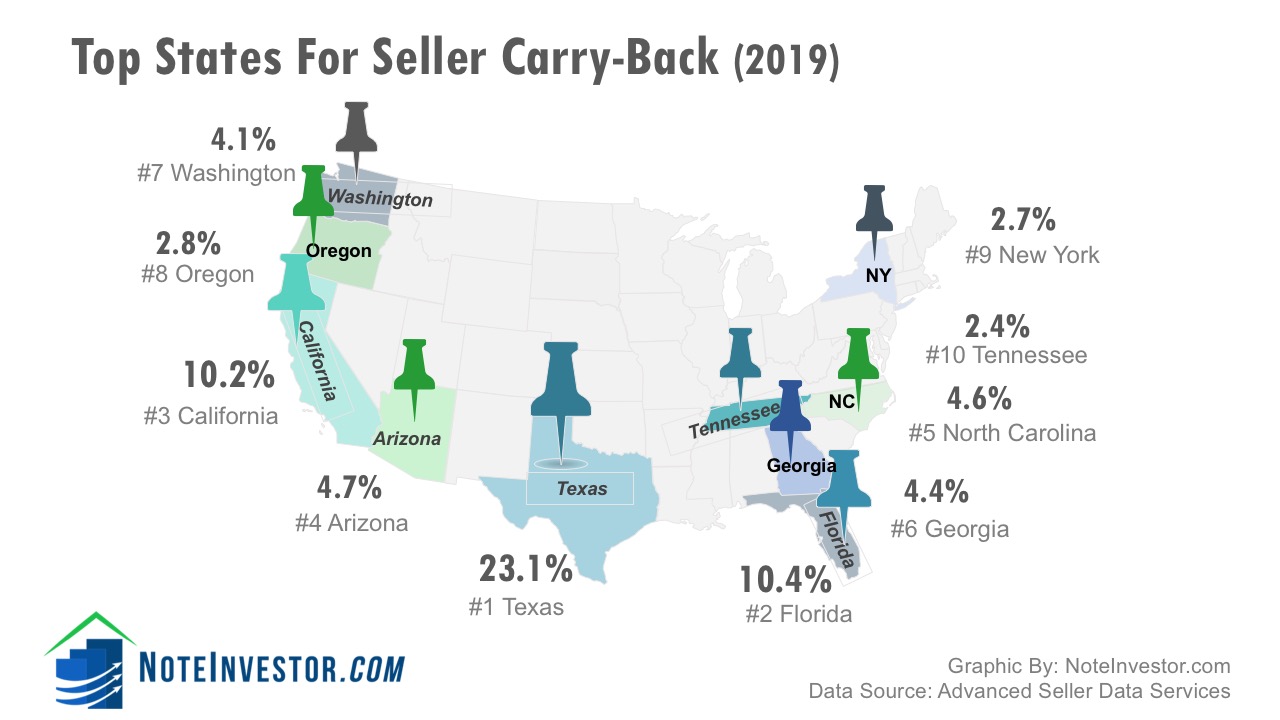
- Texas, Florida, California, Arizona, and North Carolina remained the top 5 states for seller financing based on number of transactions, followed by Georgia, Washington, Oregon and New York.
- Tennessee moved into the top ten states bumping Pennsylvania to 11th position by a slim margin.
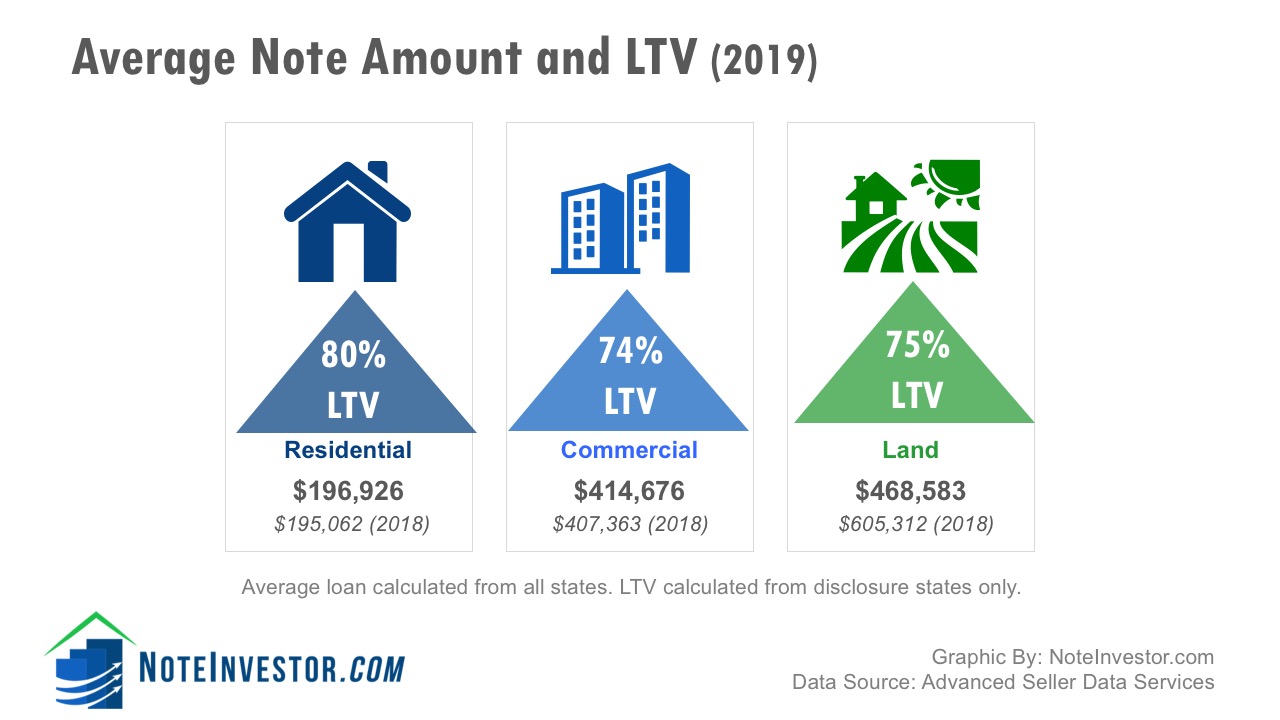
- The average Loan-to-Value (LTV) was:
- 80% LTV on new Residential notes
- 74% LTV for Commercial, and
- 75% LTV for Land notes.
- $113.8 Billion in owner financed notes were created in the past 5 years (2015 through 2019).
What About Seller Financing in 2020 and post COVID19?
The economy and real estate were strong in 2019. Home mortgages through traditional lenders were plentiful with low rates. These factors were behind the reduction of new seller carry-backs in 2019. But what about 2020? Things took an unprecedented turn when approximately 97% of the US went under some sort of stay at home orders from the Coronavirus outbreak.
Scott Arpan of Advanced Seller Data Services provides these insights:
“I believe this pandemic will greatly impact our market. It will not be possible to project trends for 2020 based on last year. The number of records we collected the third week of March dropped to 40% of counts from the third week in February. We are currently collecting about 30% of normal.
The drop in numbers is due to counties temporarily stopping data collection and slowing home sales. When the March and April sales numbers are available, we can project seller carry notes will see a similar decline for now. The remaining gap are records we have not been able to access yet.
We saw a similar drop in note creation between 2008 and 2009 followed by a doubling of notes created between 2010 and 2014. Unfortunately, record numbers of people are being furloughed from their employment. Unless the economy can quickly return to full employment, many will suffer damaged credit even when they are responsible borrowers. If they cannot qualify for a bank loan, or if the housing market softens significantly, history indicates we will see a flood of new notes.”
Owner Financing Stats From 2010 to 2019
| Year | 2010 | 2011 | 2012 | 2013 | 2014 | 2015 | 2016 | 2017 | 2018 | 2019 |
| Count | 70,159 | 89,439 | 103,313 | 110,979 | 116,178 | 105,871 | 97,089 | 89,779 | 91,605 | 86,155 |
| Change | +27.5% | +15.5% | +7.4% | +4.7% | -8.9% | -8.3% | -7.5% | +2% | -5.95% |
Seller Carry Back Notes by Property Type
The number of notes created by property type (from records where property type is known).
| 2015 | % | 2016 | % | 2017 | % | 2018 | % | 2019 | % | |
| Residential | 56,881 | 54% | 47,651 | 49% | 42,916 | 48% | 49,169 | 54% | 46,891 | 54.5% |
| Commercial | 14,841 | 14% | 14,467 | 15% | 13,930 | 16% | 13,484 | 15% | 10,458 | 12% |
| Land | 12,215 | 12% | 11,784 | 12% | 13,417 | 15% | 12,176 | 13% | 12,956 | 15% |
| Unknown | 21,934 | 21% | 23,187 | 24% | 19,516 | 22% | 16,777 | 18% | 15,850 | 18.5% |
| 105,871 | 97,089 | 89,779 | 91,605 | 86,155 |
2019 Top 10 States For Owner Financing
The Top 10 states for the creation of seller financed notes made up 68.91% of the overall volume.
| State | 2018 Count | Percentage |
| Texas | 29,898 | 23.1% |
| Florida | 8,977 | 10.4% |
| California | 8,752 | 10.2% |
| Arizona | 4,064 | 4.7% |
| North Carolina | 4,005 | 4.6% |
| Georgia | 3,799 | 4.4% |
| Washington | 3,530 | 4.1% |
| Oregon | 2,412 | 2.8% |
| New York | 2,305 | 2.7% |
| Tennessee | 2,054 | 2.4% |
| Top 10 | 59,796 | 69.4% |
| All 50 States | 86,155 |

Wondering how the remaining 40 states compared? Download the full report for a state by state listing.
Single Note Creators Vs. Multi Note Creators
There were 3,594 owner financiers (4.6%) that created more than 1 note during the 12 month period. This group is often considered a professional user of seller financing in comparison to the “Mom and Pop” seller that just creates a single note. There are also differences in the exemptions and requirements under the Dodd Frank Act based on the number of seller carry-back notes.
| 2014 | 2015 | 2016 | 2017 | 2018 | 2019 | |
| Note Count Where Seller Created 1 Note* | 102,227 | 90,078 | 78,616 | 76,675 | 75,116 | 74,586 |
| (% of Notes Created by Count) | 88% | 85% | 81% | 85% | 82% | 87% |
| Note Count from Sellers Creating More Than 1 Note* | 13,951 | 15,793 | 18,473 | 13,104 | 16,489 | 11,569 |
| Totals | 116,178 | 105,871 | 97,089 | 89,779 | 91,605 | 86,155 |
Thanks to Advanced Seller Data Services, a mailing list provider for providing these 2019 stats. They are based on 2096 counties reporting, balances of $30,000 or higher, on 1st position or wrap/AITD notes.
What are your thoughts on the recent statistics? We’d love to hear your feedback in the comment section below this article.


Hi Tracy,
Thank you for this insightful information. I have been paying attention to your work as well as Fred.
I like the way in which you approach the business.
Several years ago, a friend and I bought some 2nd position non performing notes. A year later, we felt lucky to get our investment back.
I am fascinated though and I am considering your training.
Hello Vince, Thanks for reading our blog. I hear you on the NPN 2nds. We like the performing 1st position liens. While the NPN 2nds can offer more yield opportunity they come with a whole lot more risk, drama, headaches and potential legal fees.
Thanks so much for this info. Great stuff!
You are welcome! I know you, Mitch, and the 1000 Houses group added to those Texas seller financed numbers!