The numbers are in! Here’s an in-depth look at the size of the Seller Financing Market in 2022 and where we’re heading in 2023.
Here are some stats at a glance…
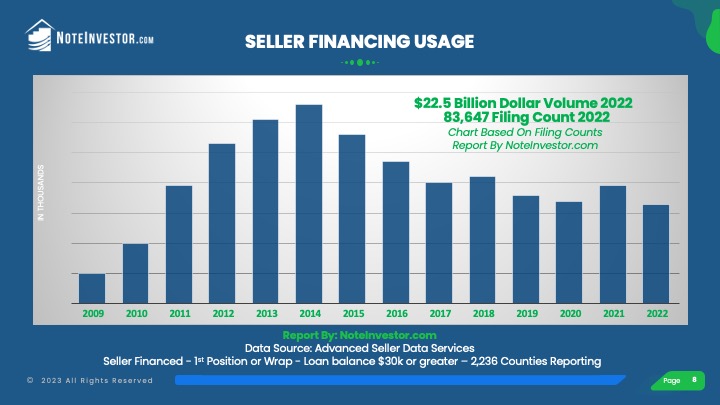
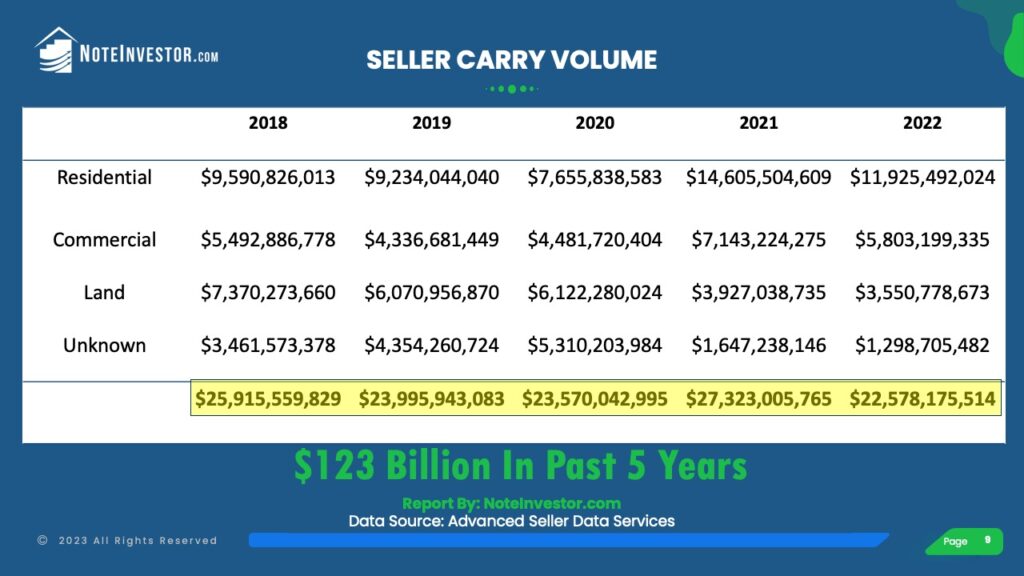
- $22.5 Billion in seller-financed notes were created in 2022 (compared to $27.3 Billion in 2021).
- 83,647 Transactions were owner financed (compared to 89,678 in 2021).
- $123 Billion in owner financed notes were created in the past 5 Years (2018 to 2022).
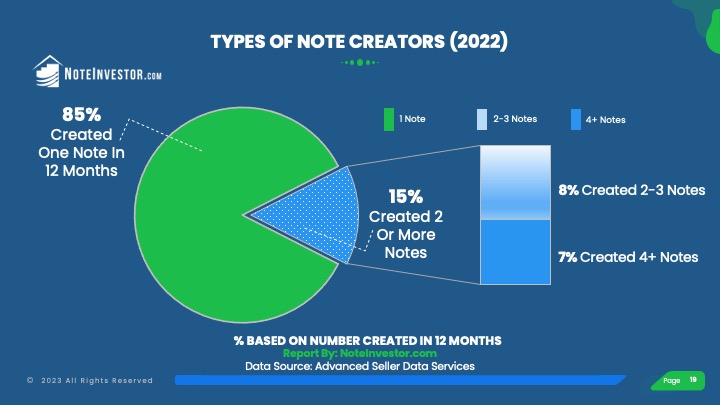
- 85% of Sellers carrying back a note created just one note in 12 months while 15% created 2 or more.
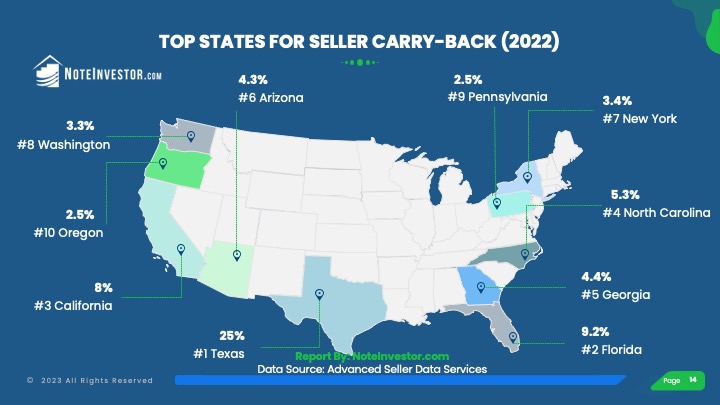
- 68% of Transactions were created in just 10 states by count.
- The average Loan-to-Value (LTV) went down across all property types:
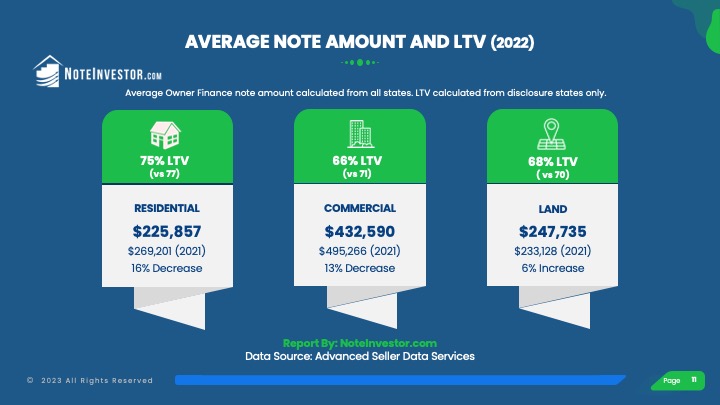
- 75% LTV on new Residential notes (compared to 77% in prior year),
- 66% LTV for Commercial, (compared to 71% in prior year), and
- 68% LTV for Land notes (compared to 70% in prior year).
Why The Decrease In Seller Financing in 2022?
2022 was the slowest year for US home sales in nearly a decade.
“The National Association of Realtors said Friday that existing U.S. home sales totaled 5.03 million last year, a 17.8% decline from 2021.
That is the weakest year for home sales since 2014 and the biggest annual decline since 2008, during the housing crisis of the late 2000s.” Source: AP News Link
The overall decrease in real estate sales impacted the volume of seller financed transactions. There were 6,031 fewer seller carry transaction, however that decrease varied by state.
California alone made up over 30% of the overall decline in seller financing with 2,135 fewer transactions, while some states like Texas had a small increase with 170 more transactions.
What about projections for 2023?
It is getting harder to obtain a conventional loan.
The Mortgage Bankers Association tracks the Mortgage Credit Availability Index. They show mortgage availability to be at its lowest since January 2013. This is due to more restrictive underwriting along with the impact of higher interest rates on payment affordability.
Source: MBA March 14, 2023
Historically, when it is harder to obtain a bank loan there is an increase in the use of seller financing.
Over the Years – the Seller Financing Numbers
| Year | 2013 | 2014 | 2015 | 2016 | 2017 | 2018 | 2019 | 2020 | 2021 | 2022 |
| Count | 110,979 | 116,178 | 105,871 | 97,089 | 89,779 | 91,605 | 86,155 | 84,007 | 89,678 | 83,647 |
| Change | +7.4% | +4.7% | -8.9% | -8.3% | -7.5% | +2% | -5.95% | -2.49% | +6.75% | -6.73% |
Seller Financing by Dollar Amount
Where Are The Notes At? – Top States for Owner Financing
The Top 5 states for seller carry backs continued to be Texas, Florida, California, North Carolina, and Georgia. All combined, the top 10 states for the creation of seller financed notes made up 67.9% of the overall volume.
| State | 2022 Count | Percentage |
| Texas | 20,922 | 25.0% |
| Florida | 7,676 | 9.2% |
| California | 6,722 | 8.0% |
| North Carolina | 4,393 | 5.6% |
| Georgia | 3,687 | 4.4% |
| Arizona | 3,628 | 4.3% |
| New York | 2,818 | 3.4% |
| Washington | 2,762 | 3.3% |
| Pennsylvania | 2,099 | 2.5% |
| Oregon | 2,054 | 2.5% |
| Top 10 | 56,761 | 67.9% |
| All 50 States | 83,647 |
Wondering how the remaining 40 states compared? Download the full report for a state by state listing.
It’s Not Just Residential Notes – Carry Back Notes by Property Type
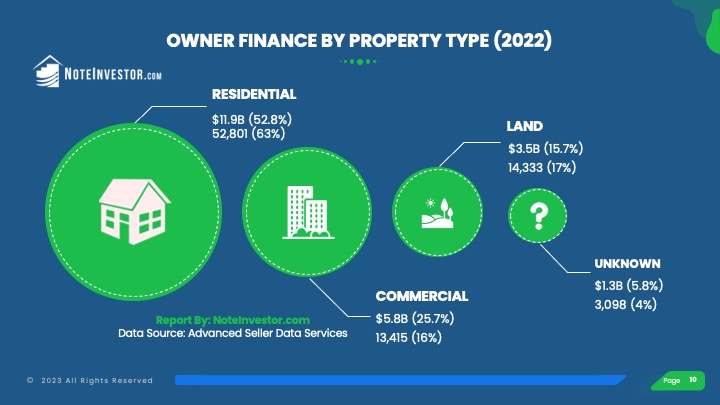
Seller-carry covers residential, commercial, and land. Here is a look at the number of notes created by property type (from records where property type is known).
| 2018 | % | 2019 | % | 2020 | % | 2021 | % | 2022 | % | |
| Residential | 49,169 | 54% | 46,891 | 54.5% | 42,359 | 50% | 54,443 | 61% | 52,801 | 63% |
| Commercial | 13,484 | 15% | 10,458 | 12% | 10,588 | 13% | 14,794 | 16% | 13,415 | 16% |
| Land | 12,176 | 13% | 12,956 | 15% | 13,608 | 16% | 16,921 | 19% | 14,333 | 17% |
| Unknown | 16,777 | 18% | 15,850 | 18.5% | 17,452 | 21% | 3,520 | 4% | 3,098 | 4% |
| 91,605 | 86,155 | 84,007 | 89,678 | 83,647 |
Average Note Size, Down Payment and LTV For Seller Financing
The average residential note balance was $225,857 for seller carried notes in 2022. The average Loan-to-Value (LTV) was 75% which correlates to a down payment of 23%. Many people mistakenly believe that all seller financing involves little to no money down. However this chart shows the average down payment has been 20% or more in all property categories for the past 4 years (LTV calculated using data from states with sales price disclosure).
| 2019 | LTV% | 2020 | LTV% | 2021 | LTV% | 2022 | LTV% | |
| Residential | $196,926 | 80% | $180,737 | 82% | $269,201 | 77% | $225,857 | 75% |
| Commercial | $414,676 | 74% | $423,283 | 75% | $495,266 | 71% | $432,590 | 66% |
| Land | $468,583 | 75%% | $449,903 | 76% | $233,128 | 70% | $247,735 | 68% |
Single Note vs. Multi-Note Creations
The group of sellers creating 2 or more notes in a 12 month period were responsible for 16% of the new notes created. When you break down this group further we see 9% in the 2-3 notes per year and 7% in the 4 or more category. This group is often considered a professional user of seller financing in comparison to the “Mom and Pop” seller that just creates a single note in a year. There are also differences in the exemptions and requirements under the Dodd Frank Act based on the number of seller carry-back notes.
| 2018 | 2019 | 2020 | 2021 | 2022 | |
| Note Count Where Seller Created 1 Note* | 75,116 | 74,586 | 68,257 | 75,279 | 70,807 |
| (% of Notes Created by Count) | 82% | 87% | 81% | 84% | 85% |
| Note Count from Sellers Creating More Than 1 Note* | 16,489 | 11,569 | 15,750 | 14,399 | 12, 840 |
| Totals | 91,605 | 86,155 | 84,007 | 89,678 | 83,647 |
Thanks to Advanced Seller Data Services, a mailing list provider for providing these 2022 stats. They are based on 2,236 counties reporting, balances of $30,000 or higher, on 1st position or wrap/AITD notes.
What are your thoughts on the recent statistics? Leave your comments below.

