
Following a year of growth, we continued to see strong owner financing numbers in 2024 with an 8% increase in dollar volume of created notes compared to last year.
Let’s dive into the numbers and see what other trends we saw.
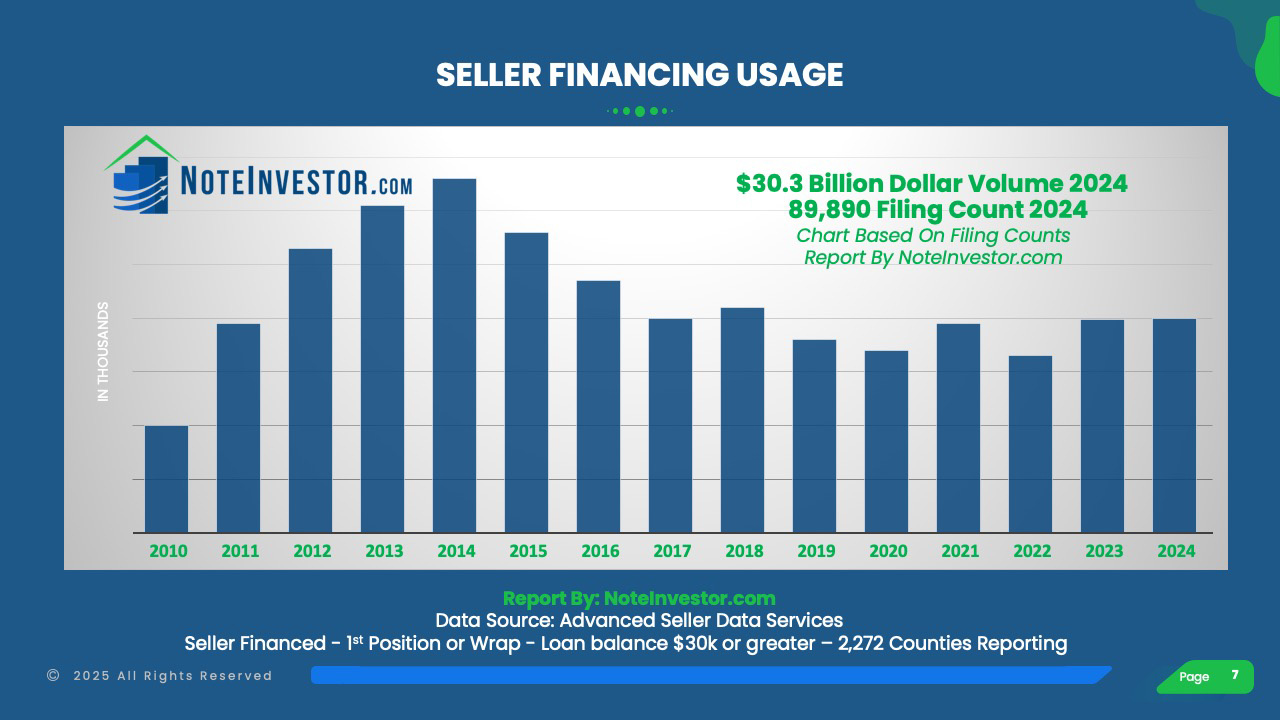
- $30.3 Billion in seller-financed notes were created in 2024 (up 8% from the $28 Billion in 2023)
- 89,890 Transactions were owner financed (only up slightly from the 89,773 in 2023).
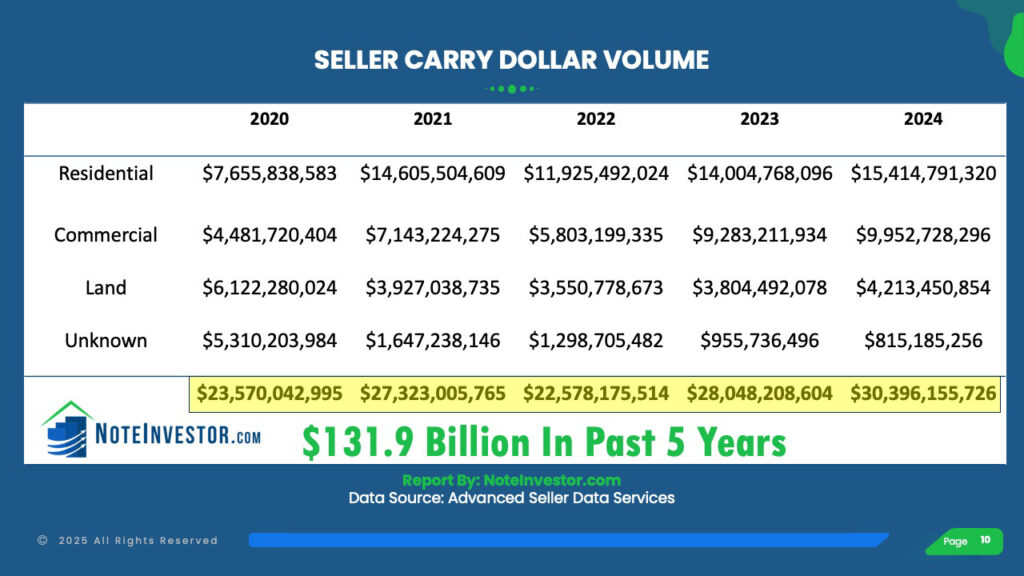
- $131.9 Billion in owner financed notes were created in the past 5 Years (2020 to 2024).
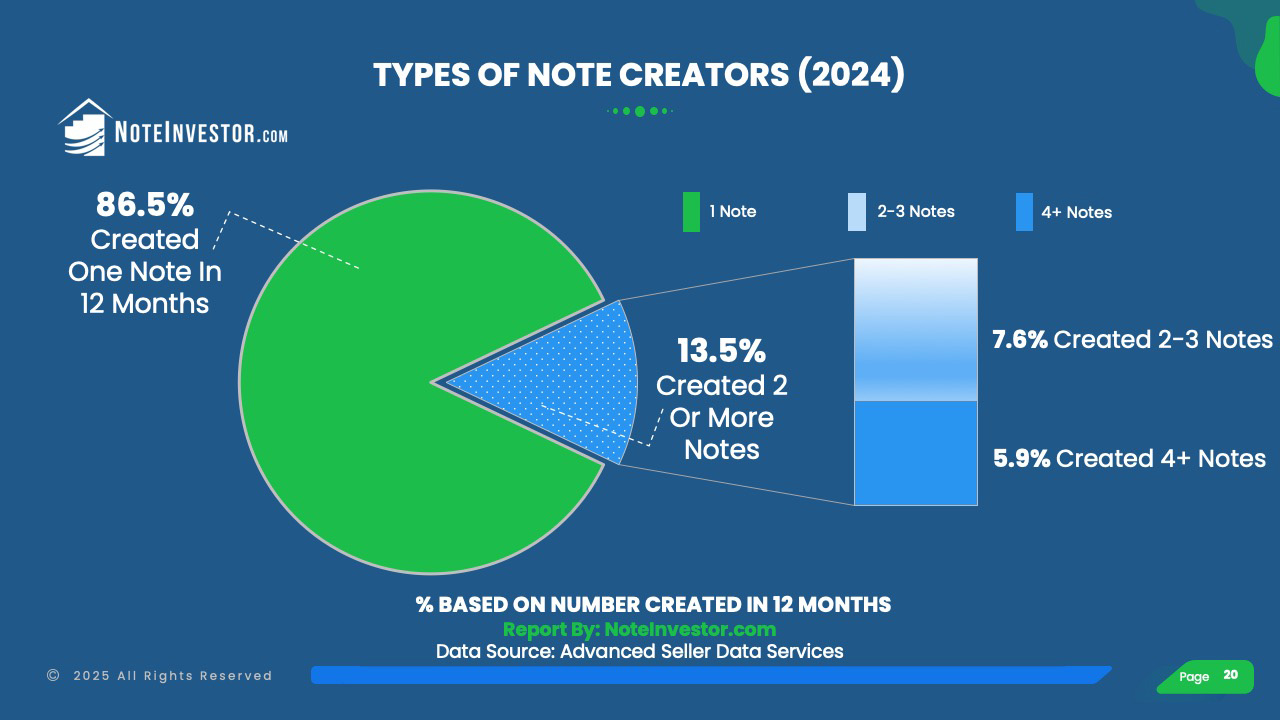
- Sellers creating one note in 12 months made up 86% of the seller carry notes.
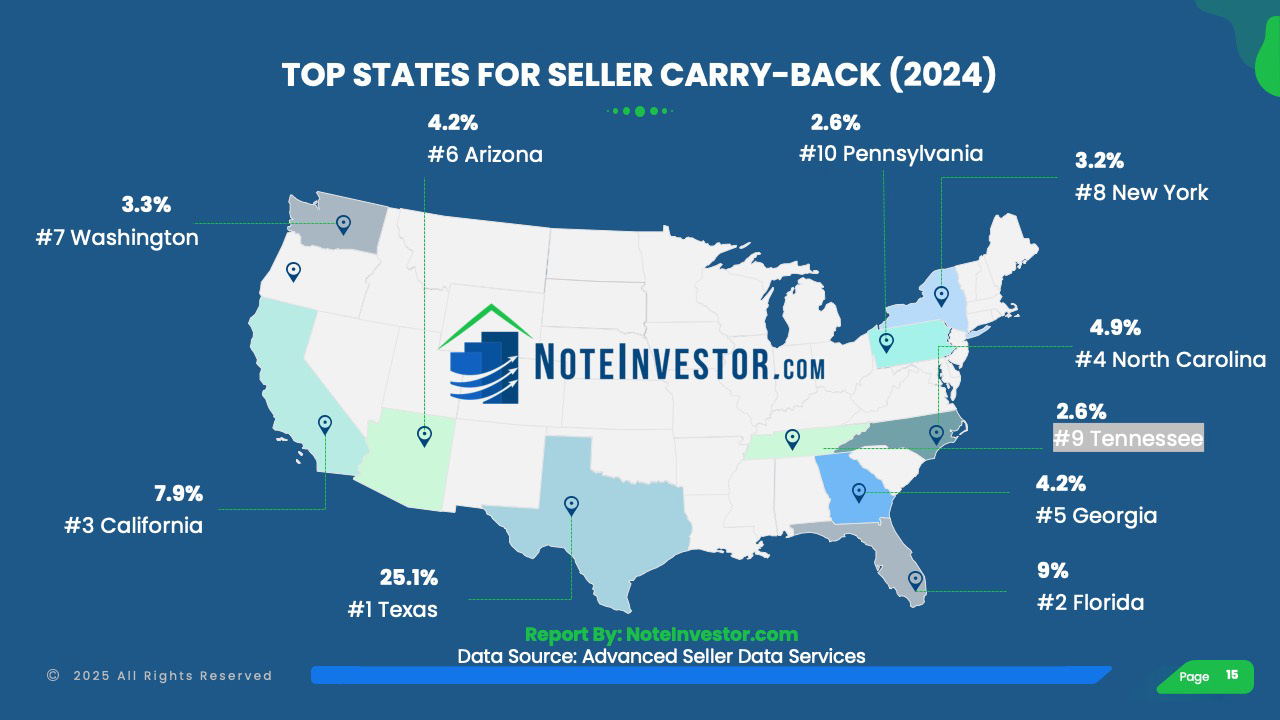
- 67% of transactions were created in just 10 states.
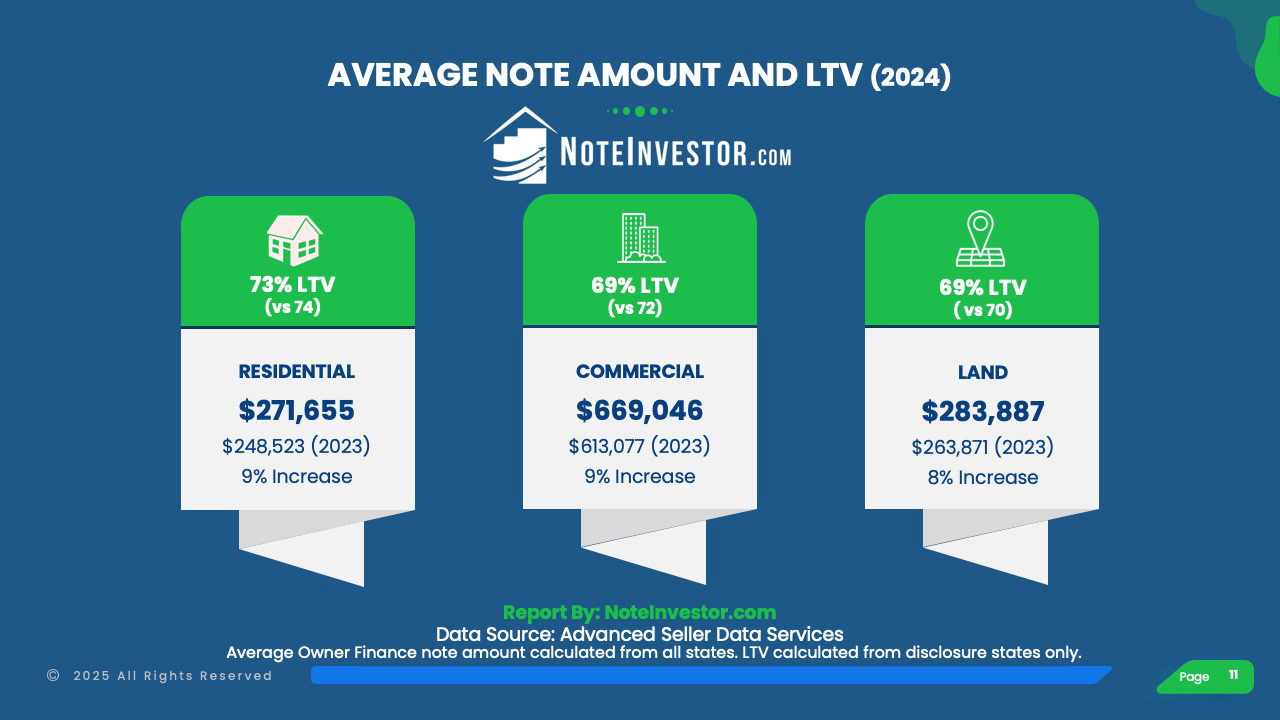
- The average dollar amount for new seller financed notes increased while the average LTV went down for residential, commercial and land notes.
- 73% LTV for Residential
- 69% Average LTV for Both Commercial and Land

Insights on Owner Financing Trends
Even as overall real estate activity cooled, the consistent creation of private notes underscores a resilient demand for seller financing as an alternative funding source.
The National Association of Realtors reported that existing U.S. home sales in 2024 experienced a 0.7% decline. That is the weakest year for home sales since 1995, echoing the prior year results when it dropped over 18% in 2023. (Source: Associated Press Jan 24, 2025)
Considering the number of overall existing home sales fell significantly in the past two years – yet the number of seller-financed deals held strong and increased in each of the years – it clearly reflects the need for credit availability outside of conventional mortgages.
Tens of billions in capital flowed through the seller-carry note market. Notably, individual note sizes have continued to increase. The average owner-financed residential note was about $271,655 in 2024. That’s over a 50% increase in the past 5 years compared to the $180,737 average in 2020.
Private mortgage notes offer high yield returns that keep investors actively interested in this asset class. More importantly, these notes are generally well-collateralized with borrowers putting down 27-31% of the property value, resulting in average loan-to-value ratios between 69–73%.
Through the Years – the Seller Financing Numbers
| Year | 2015 | 2016 | 2017 | 2018 | 2019 | 2020 | 2021 | 2022 | 2023 | 2024 |
| Count | 105,871 | 97,089 | 89,779 | 91,605 | 86,155 | 84,007 | 89,678 | 83,647 | 89,773 | 89,890 |
| Change | -8.9% | -8.3% | -7.5% | +2% | -5.95% | -2.49% | +6.75% | -6.73% | +7.32% | +0.13% |
Seller Financing by Dollar Amount
The Top States – Which States Dominated in 2024
Similar to 2023, the top 10 states for seller-financed note creation accounted for 67% of the total volume. However, there was a shake-up in the rankings, with Tennessee replacing Oregon in this year’s Top 10. Meanwhile, the Top 5 remained unchanged, with Texas, Florida, California, North Carolina, and Georgia leading the way.
| State | 2023 Count | 2024 Count | Percentage |
| Texas | 22,361 | 22,584 | 25.1% |
| Florida | 8,270 | 8,088 | 9.0% |
| California | 7,220 | 7,083 | 7.9% |
| North Carolina | 4,500 | 4,362 | 4.9% |
| Georgia | 4,055 | 3,767 | 4.2% |
| Arizona | 3,662 | 3,757 | 4.2% |
| Washington | 2,913 | 2,955 | 3.3% |
| New York | 2,765 | 2,875 | 3.2% |
| Tennessee | was PA – 2,331 | 2,355 | 2.6% |
| Pennsylvania | was OR – 2,186 | 2,341 | 2.6% |
| Top 10 | 60,263 | 60,167 | 66.9% |
| All 50 States | 89,773 | 89,890 |
Wondering how the remaining 40 states compared? Download the full report for a state by state listing.
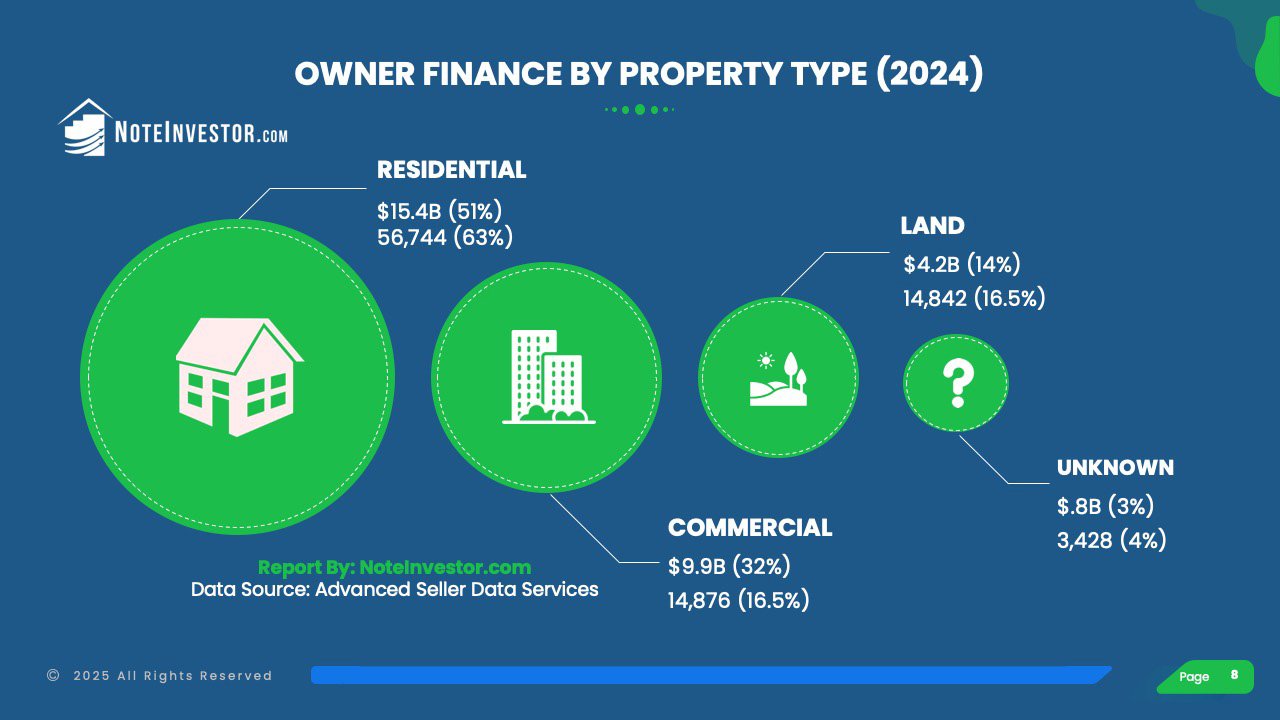
Carry Back Notes by Property Type – Finding Opportunity
Residential seller-financed notes still lead the market, but there’s plenty of room to explore commercial and land notes. Here’s a snapshot of how note creation breaks down by property type (where data is available).
| 2020 | % | 2021 | % | 2022 | % | 2023 | % | 2024 | % | |
| Residential | 42,359 | 50% | 54,443 | 61% | 52,801 | 63% | 56,352 | 63% | 56,744 | 63% |
| Commercial | 10,588 | 13% | 14,794 | 16% | 13,415 | 16% | 15,142 | 17% | 14,876 | 17% |
| Land | 13,608 | 16% | 16,921 | 19% | 14,333 | 17% | 14,418 | 16% | 14,842 | 17% |
| Unknown | 17,452 | 21% | 3,520 | 4% | 3,098 | 4% | 3,861 | 4% | 3,428 | 4% |
| 84,007 | 89,678 | 83,647 | 89,773 | 89,890 |
Average Note Size, Down Payment and LTV For Seller Financing
Residential note balances climbed in 2024, averaging $271,655 compared to $248,523 in 2023. The typical Loan-to-Value (LTV) ratio came in at 73%, meaning buyers put down about 27%—only slightly lower than last year’s 74% LTV. Once again, the numbers prove that owner financing doesn’t always mean little to no money down. (LTV based on data from states with sales price disclosure.)
| 2021 | LTV% | 2022 | LTV% | 2023 | LTV% | 2024 | LTV% | |
| Residential | $269,201 | 77% | $225,857 | 75% | $248,523 | 74% | $271,655 | 73% |
| Commercial | $495,266 | 71% | $432,590 | 66% | $613,077 | 72% | $669,046 | 69% |
| Land | $233,128 | 70% | $247,735 | 68% | $247,536 | 82% | $283,887 | 69% |
Single Note vs. Multi-Note Creations
The majority of notes continued to be created by “Mom and Pop” sellers in 2024. The group of sellers creating 2 or more notes (the group often coined the professional user of owner financing) in a 12 month period were responsible for 14% of the new notes created. When you break down this group further we see 8% in the 2-3 notes per year and 6% in the 4 or more category — similar percentages as in 2023.
The group where the seller created one note is considered the “Mom and Pop” seller. There are also differences in the exemptions and requirements under the Dodd Frank Act based on the number of seller carry-back notes.
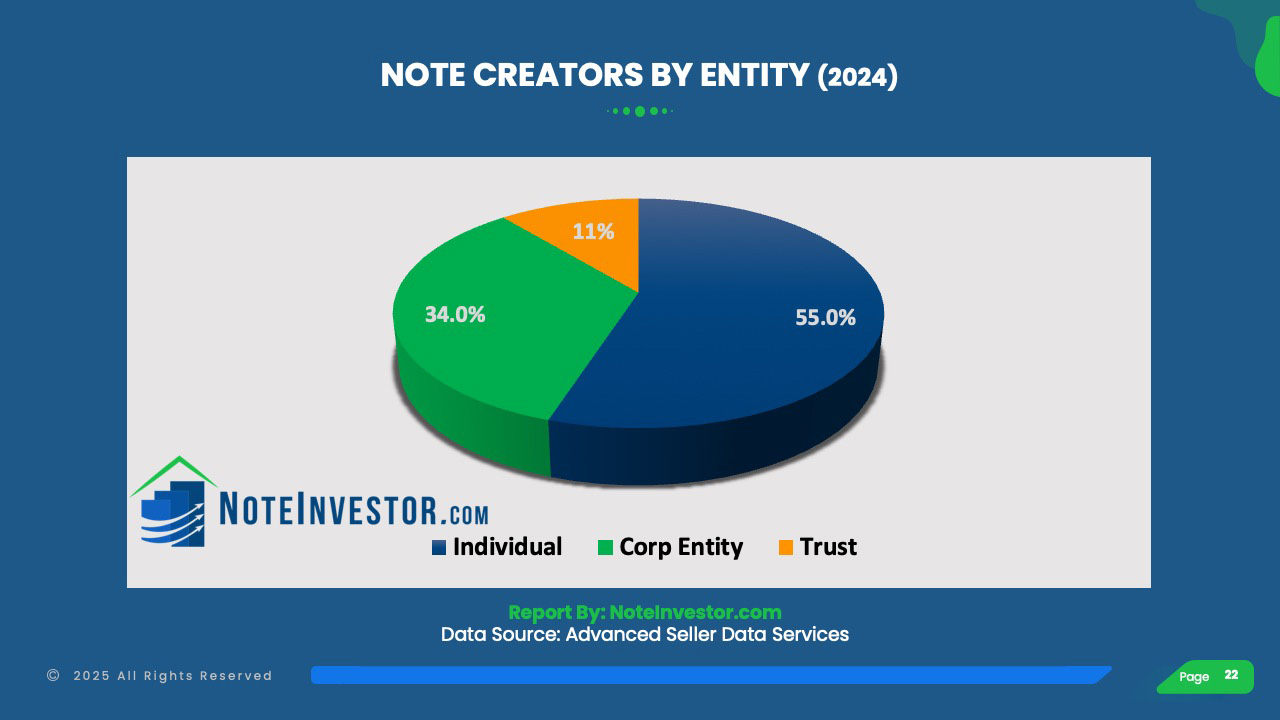
One trend that developed in 2024 was how title was held on notes created. Last year Revocable Trusts made up 34% of the notes created (compared to 32% the prior year). Corporate Entities held steady at 11%, with Individual holdings down to 55% (from 57% the prior year).
| 2020 | 2021 | 2022 | 2023 | 2024 | |
| Note Count Where Seller Created 1 Note* | 68,257 | 75,279 | 70,807 | 76,780 | 77,754 |
| (% of Notes Created by Count) | 81% | 84% | 85% | 86% | 86% |
| Note Count from Sellers Creating More Than 1 Note* | 15,750 | 14,399 | 12,840 | 12,993 | 12,136 |
| Totals | 84,007 | 89,678 | 83,647 | 89,773 | 89,890 |
Notes Created by Individual, Corporate Entity or Trust
May was the strongest month for note creation with over 8,300 notes created. The next best months were April and July with around 7,900 notes created in each month.
Thanks to Advanced Seller Data Services, a mailing list provider for providing these 2024 stats. They are based on 2,272 counties reporting, balances of $30,000 or higher, on 1st position or wrap/AITD notes.
What are your thoughts on the last year’s seller financing statistics? Leave your comments below.

Leave a Reply